Elastic vs Chaos: Normalising Control-M Logs for Observability
Categories:
[elastic],
[control-m],
[observability],
[logstash],
[devops],
[real-world]
Tags:
[elastic],
[control-m],
[observability],
[logstash],
[devops],
[real-world]
Part 1 – The Agent Frontlines

The Mess Behind the Scheduler
I’ve always had a soft spot for Control-M. It’s one of those quietly terrifying systems that just runs — until it doesn’t.
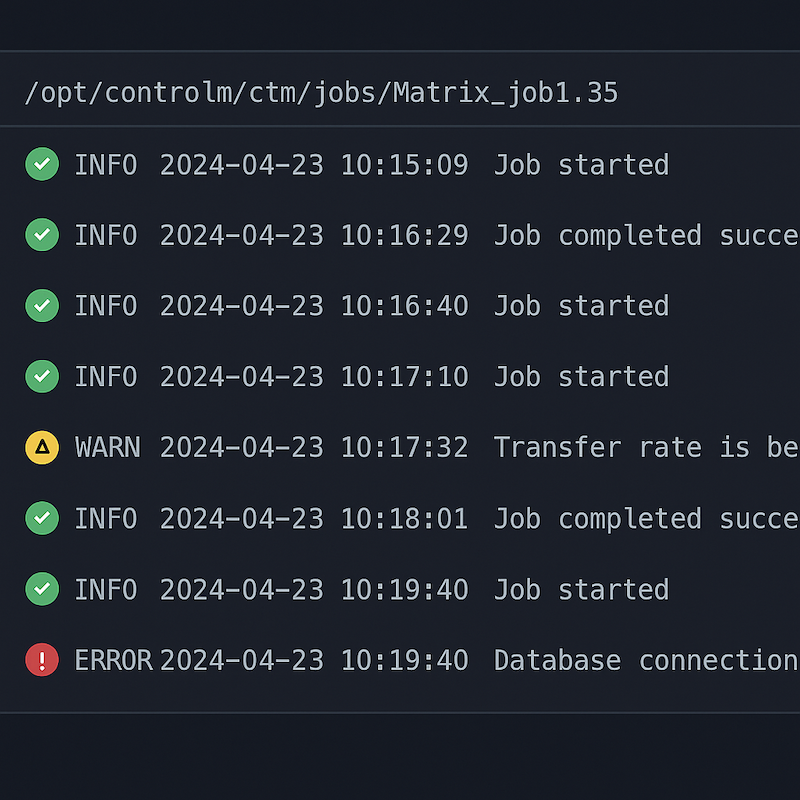
And when it doesn’t, you don’t get a tidy stack trace; you get a log file that looks like a ransom note written by three different developers and a COBOL job from 1998.
My first deep dive into Control-M observability started with a simple question from ops:
“Can we get this into Elastic so we can actually see what’s happening?”
I said yes before remembering how Control-M logs actually look.
The first agent I connected to greeted me with 17 GB of flat text spread across sysout, proclog, out, and err.
Some entries had timestamps. Some didn’t. Some were in UTC, others in whatever time zone the admin felt like that day.
You learn humility fast when you tail a Control-M joblog at 2 a.m.

The Jungle of Logs
Before you can make sense of it, you need to know where everything hides.
| Log Type | Typical Path | Description |
|---|---|---|
joblog |
$HOME/ctm/sysout/ |
The “official” story of a job run (when you’re lucky). |
out / err |
$HOME/ctm/out/ |
Whatever your scripts decide to print. |
sysout |
/opt/controlm/ctm_sys/ |
Agent background noise; occasionally useful. |
proclog |
/var/log/controlm/proclog/ |
Process chatter, heartbeats, restarts. |
statistics |
Database tables, for later. | Where truth goes to die. |
When you have 150 agents across 2 000 servers, these logs multiply like fruit flies.
A typical “nice” log looks like this:
==== JOB ENDED OK  (DAILY_REPORT) ====
Ended: 2025-10-27 22:14:37
CPU Time: 00:00:02
And then there’s the other kind — the one that just says:
JOBNAME: DAILY_REPORT
ENDED OK
That’s not a log; that’s a shrug in ASCII.
Reality check: Control-M was built to run jobs, not to be pretty. Parsing it means forgiving a lot of design sins.
Why Normalise at All?
You could throw those logs into Elastic raw, sure — but you’d get a sea of text and no insight.
What I wanted was structure without fantasy — something honest enough to represent the chaos, but consistent enough to let me build a dashboard.
So I mapped the journey:
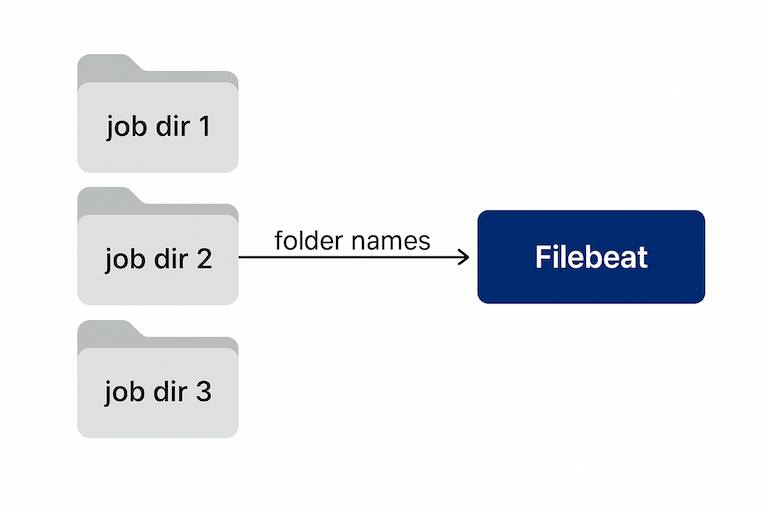
- Collect – Filebeat on each agent.
- Normalise – Logstash filters that bend but don’t break.
- Enrich – Add metadata (hostnames, job IDs, timestamps).
- Index – ECS-friendly documents Kibana won’t choke on.

Building a Pipeline That Doesn’t Cry
Here’s where the real work happens — the part that separates a pretty diagram from an operational system.
I didn’t want another brittle ingest that died the moment someone renamed a log. I wanted elasticity inside Elastic.
Logs came from a predictable chaos:
/opt/controlm/ctm/sysout/<AGENT>/<JOBNAME>/<DATE>/joblog…but naming discipline varied by region, so the path itself became one of my best data sources.
Filebeat didn’t just read logs — it understood where it found them:
fields_under_root: true
fields:
  ctm_agent_path: "${path}"
  ctm_agent: "${path_basename_3}"   # Extracted agent name
  ctm_job: "${path_basename_2}"     # Derived job folder
Each Filebeat instance carried a local name (filebeat.agent.hostname) reused as controlm.agent.id.
By the time data reached Logstash, I already knew:
- which agent wrote it;
- which job directory it came from;
- which environment (DEV, QA, PROD) by folder prefix.
That contextual metadata became the bones of the event — the part I could trust even when the text inside was nonsense.

The Logstash Philosophy
Every line was an unreliable witness.
The pipeline became a series of interrogations:
- Multiline joined all lines starting with
^==== JOB. - Dissect turned file paths into
controlm.job.nameandcontrolm.agent.host. - Grok parsed known patterns.
- Enrichment filled gaps from path fields.
- Date politely searched for timestamps, then defaulted to metadata.
dissect {
  mapping => {
    "[log][file][path]" => "/opt/controlm/ctm/sysout/%{controlm.agent.host}/%{controlm.job.name}/%{+event.date}/joblog"
  }
}
Then the extras:
mutate {
  add_field => {
    "controlm.environment" => "%{[agent][name]}"
    "controlm.pipeline" => "agent_ingest"
  }
}
Small win: At first we had 12 unique job names. After path enrichment, 3 987 — actual visibility.
Grok with Mercy
Better 80 % truth than 100 % fiction.
We used progressive grok — a hierarchy of patterns from strict to loose.
grok {
  match => [
    "message", "==== JOB ENDED %{WORD:controlm.job.status}\s+\(%{WORD:controlm.job.id}\).*",
    "message", "JOBNAME:\s+%{WORD:controlm.job.name}"
  ]
  tag_on_failure => ["_grok_fail"]
}
When parsing failed, secondary grok looked for anything timestamp-like.
Everything else landed in log.unparsed, later mined by ML.

The Time Problem
Time in Control-M logs is a suggestion, not a guarantee.
So we built a hierarchy of trust:
Ended:line → primary source.- File mtime → fallback.
- Ingestion time → last resort.
No more jobs ending tomorrow.
Enrichment as Context, Not Decoration
We attached:
- Agent host + IP
- Job name (from path)
- Environment (from agent name)
- Pipeline origin (
agent_ingest_v1) - Raw file hash (SHA1 dedupe)
Result:
controlm:
  job:
    name: DAILY_REPORT
    id: J12345
    status: ENDED_OK
  agent:
    host: ctm-agent-01
    environment: PROD
event:
  start: 2025-10-27T22:14:35Z
  end:   2025-10-27T22:14:37Z
log:
  file:
    path: /opt/controlm/ctm/sysout/ctm-agent-01/DAILY_REPORT/20251027/joblog
  sha1: a1b2c3d4e5...
Lesson: Don’t enrich to impress — enrich to explain.
When Chaos Starts Behaving
The first time I saw it in Kibana, I smiled.
After weeks of grey text, dashboards felt like sunlight breaking through.
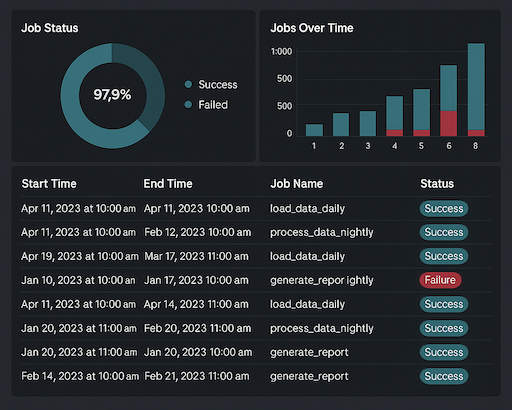
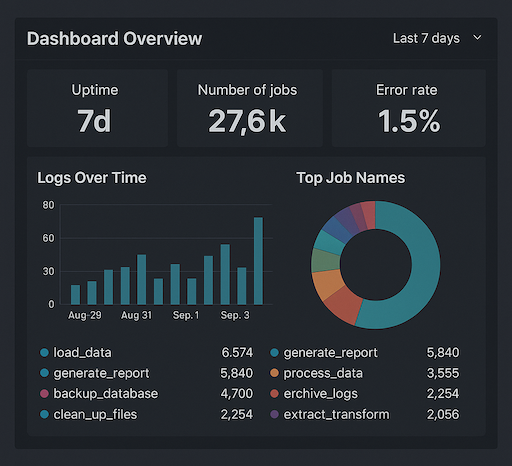
Top panels: jobs per hour, average duration, success vs failure.
Bottom: agents by volume, error types, no-timestamp count.

Patterns emerged.
We found an agent whose CPU time spiked every Thursday — a rogue backup job.
No one had noticed for months.
That’s the power of structure: not perfection, but visibility.
Things the Logs Taught Me
- Agents are snowflakes.
- Parsing is archaeology.
- Trust beats detail.
- Over-normalising kills agility.
- _grokfail is a friend.
“Logs lie,” one of our ops guys said, “but they lie in predictable ways.”
By the time we stabilised, parsing accuracy rose from 40 % to 98 %.
Elastic finally started looking like something worth paying for.

The Moment of Clarity
A funny thing happens when you make chaos visible — it becomes boring.
And boring, in infrastructure, is the dream.
Two weeks without touching the pipeline. No errors. No surprises.
That’s when you know observability works: when it stops being exciting.
What Comes Next
This was just the agent side — the visible battlefield.
Part 2 goes deeper into the Control-M database, where job statistics hide behind opaque tables and numeric codes.
That’s where “structured” stops meaning “understandable.”