When Logs Lie, Dashboards Die: Surviving the Observability Delusion
Categories:
[observability],
[cto-journal]
Tags:
[elastic],
[akamas],
[telemetry],
[optimization],
[devops]
In the war room, everyone stares at the dashboards like they’re sacred truth.
The graphs are beautiful, the colours reassuring.
But here’s the problem: the dashboards are lying to you.
They’re not doing it maliciously.
They’re lying because the data feeding them is wrong, noisy, incomplete, or just plain irrelevant.
And in 2025, that’s an easy trap to fall into — because it has never been easier to deploy a monitoring stack that looks impressive while quietly misleading you.
The Day We Stopped Believing the Dashboards
We had Elastic Stack humming along. Filebeat and Metricbeat were shipping data like clockwork.
Logstash was enriching everything with clean metadata. Kibana dashboards? Gorgeous.
Every service had a view. Every alert rule was documented.
And yet… incidents kept turning into scavenger hunts.
One false correlation after another.
Metrics that looked bad but weren’t.
Services accused of failures they didn’t cause.

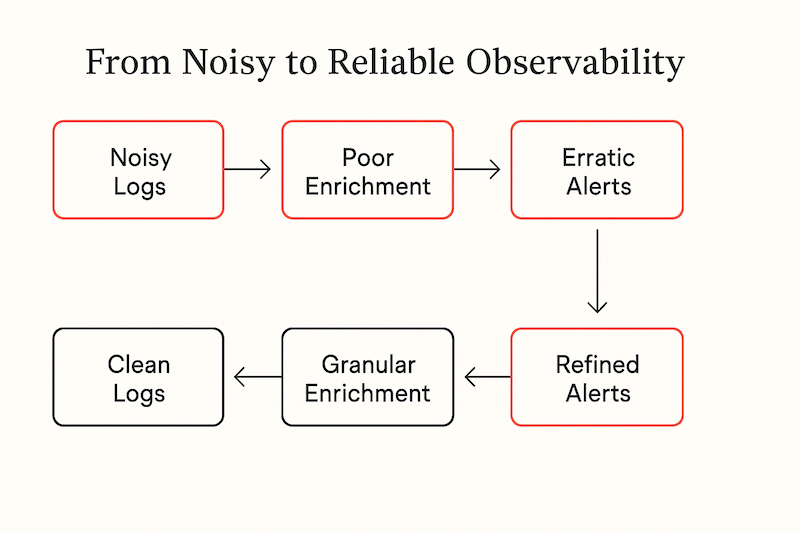
The truth finally hit: we weren’t dealing with an outage problem.
We were dealing with a telemetry problem.
Our system was collecting all the wrong things, all the time — and the dashboards were faithfully rendering that noise.
Why We Couldn’t Just “Fix It by Hand”
Sure, we could have started manually pruning logs and tweaking metrics.
But with over twenty microservices, each with its own logging habits and metric quirks, manual tuning would have taken months — and every guess risked breaking something important.
That’s when Akamas entered the picture.
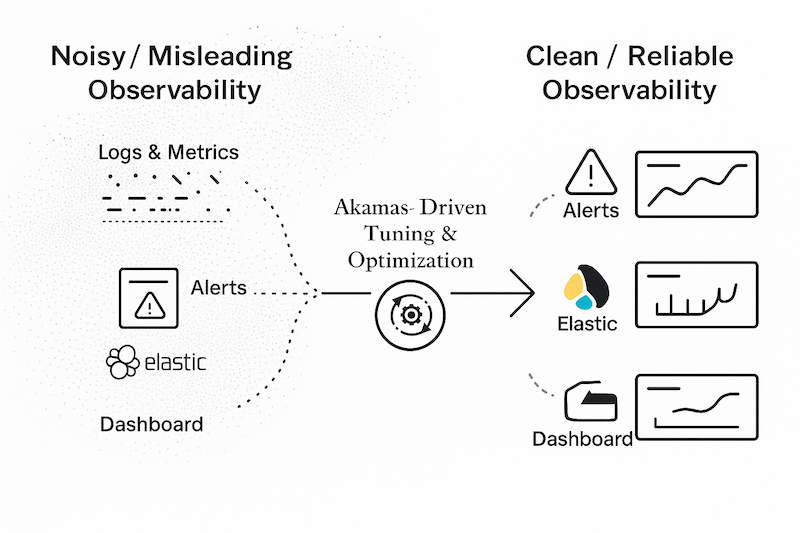
Not as a “monitoring tool” — it’s not — but as a way to experiment with our observability stack like we would with application performance.
Turning Observability Into an Experiment
We decided to treat our telemetry pipeline as a tunable system.
Akamas would:
- Pull real KPIs directly from Elasticsearch queries.
- Systematically adjust parameters like Filebeat batch size, Logstash worker threads, Metricbeat scrape intervals, and Elasticsearch refresh intervals.
- Compare results against objectives: higher alert precision, lower ingestion volume, faster anomaly detection.
- Roll back instantly if any trial degraded performance.
The first experiment ran in a staging environment with production‑like load.
Over 48 hours, Akamas tested dozens of safe parameter combinations, each time measuring how signal quality and detection latency changed.
What Changed When We Trusted the Data Again
The winning configuration didn’t just lower costs — it changed how we worked.
Log ingestion dropped by 42%.
Alert precision jumped by nearly a third.
Median dashboard load times improved by 40%.
And perhaps most importantly, operators stopped chasing ghosts.
Now, when a dashboard flashes red, we know it’s worth looking at.
That’s a cultural shift as much as a technical one.

Why This Matters in 2025
Telemetry tuning is performance tuning.
You wouldn’t run your production workloads without profiling and optimization.
Your observability stack deserves the same care — because it drives your operational decisions.
Akamas gave us the confidence to make those tuning changes fast and safely, without the endless cycle of guess‑and‑check.
The takeaway?
Beautiful dashboards mean nothing if they’re painting the wrong picture.
Trust comes from a feedback loop — one that measures, experiments, and keeps only what proves its value.